infObjects
A 3D data visualization for the topic of food
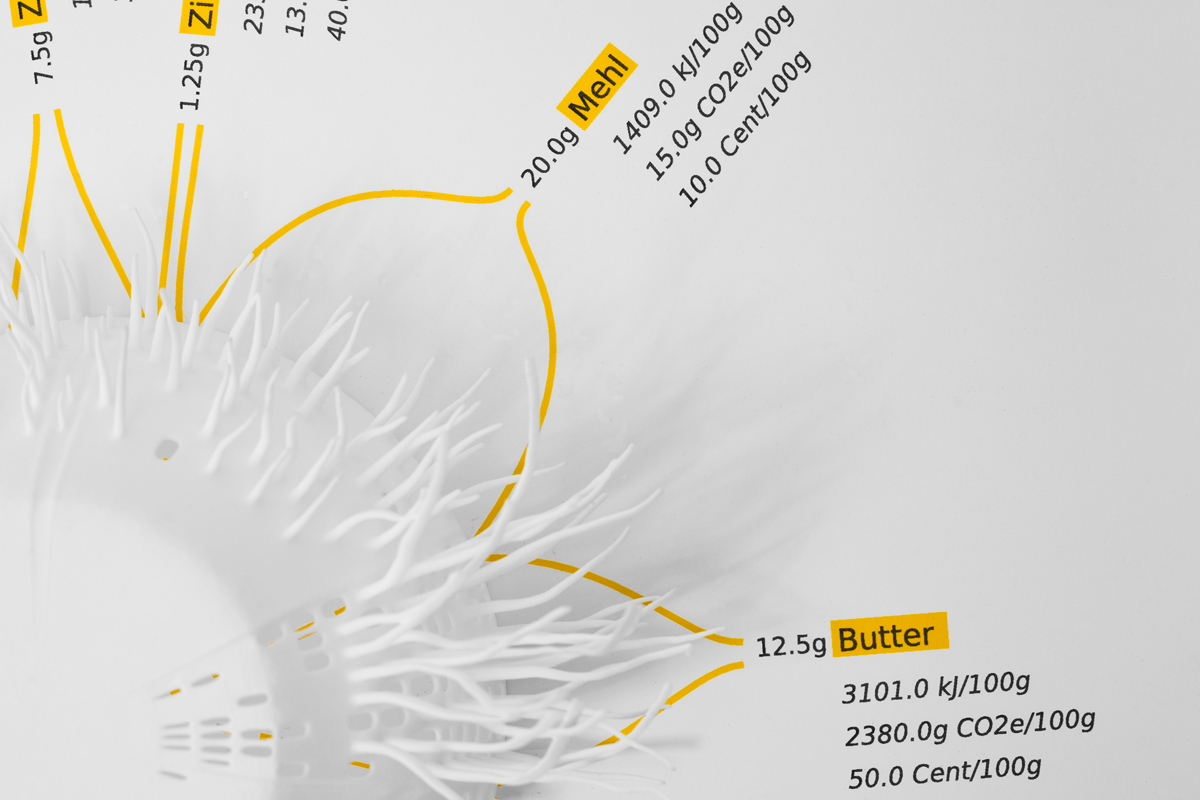
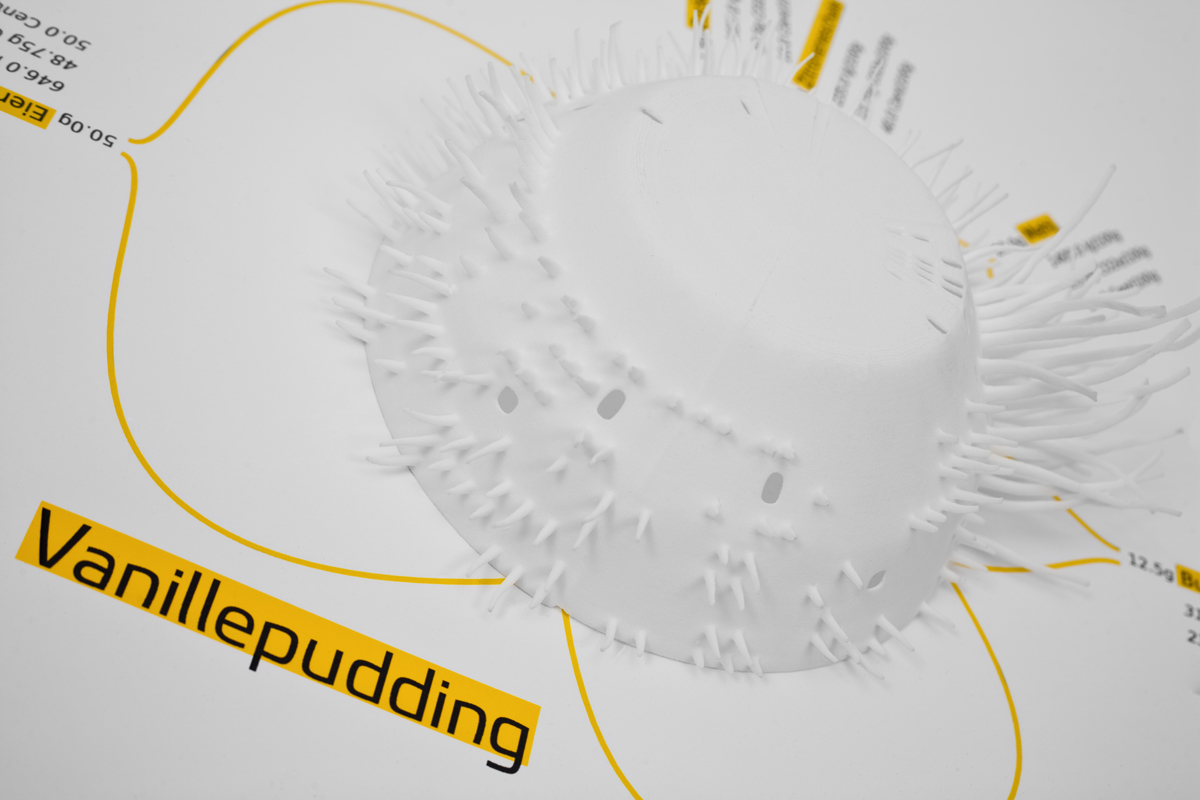
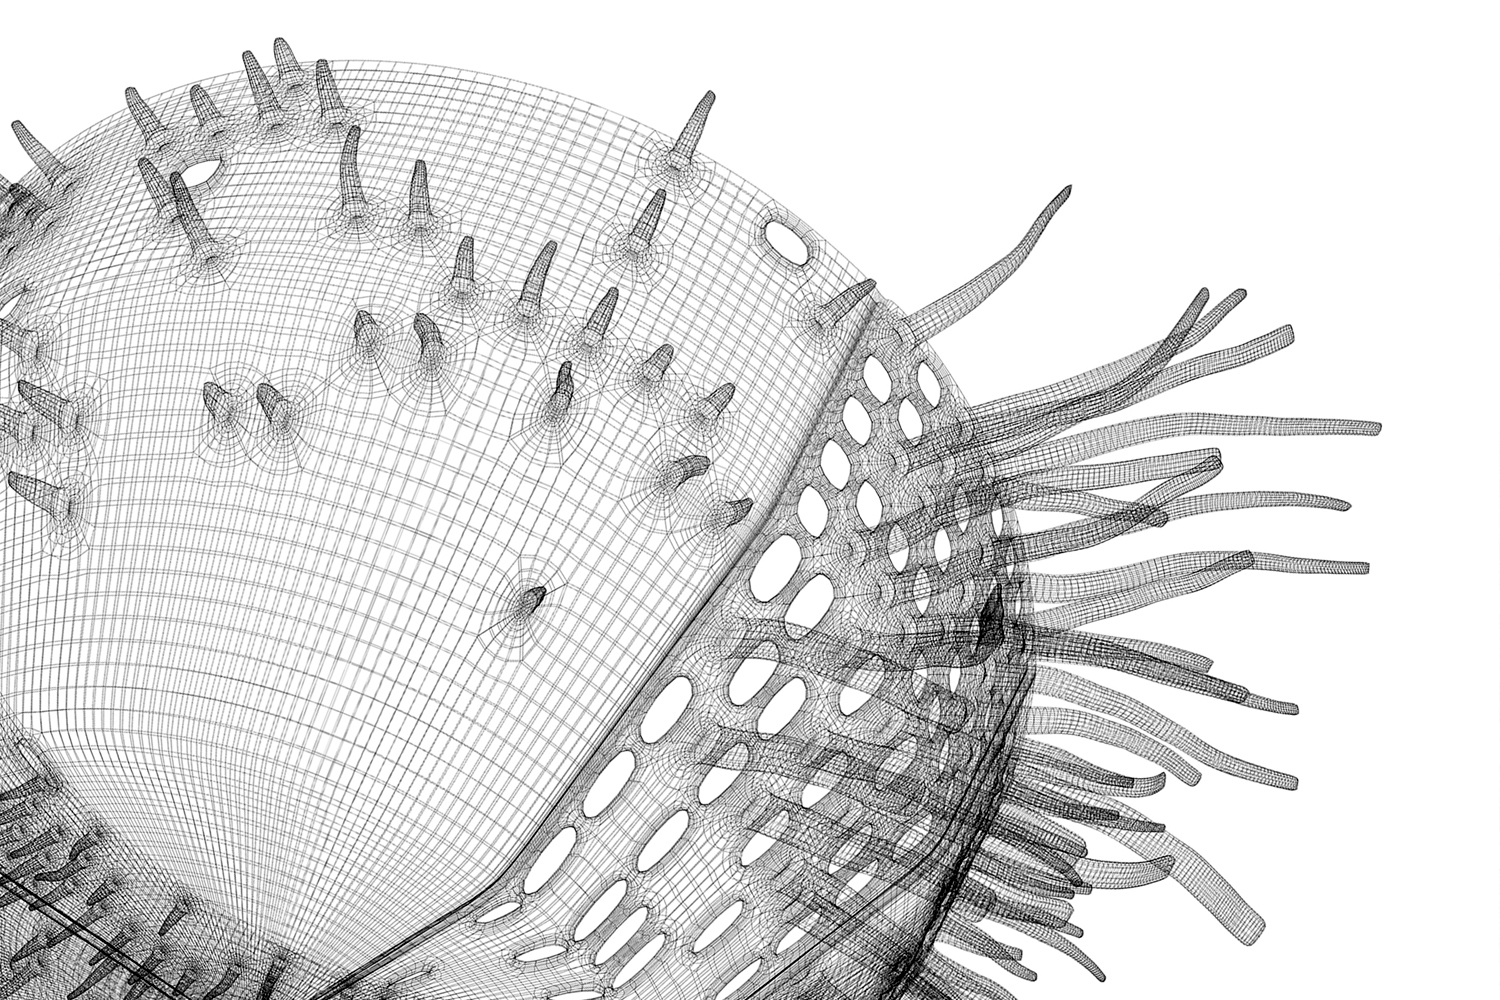
Nowadays information is accessible very easily. Still, due to the amount of data available and its complexity, it is often difficult to really understand. So the importance of tools that help us to comprehend important correlations more easily increases. infObjects is such a tool. It translates abstract scientific information about food into tangible shapes that can be 3d printed out as objects.
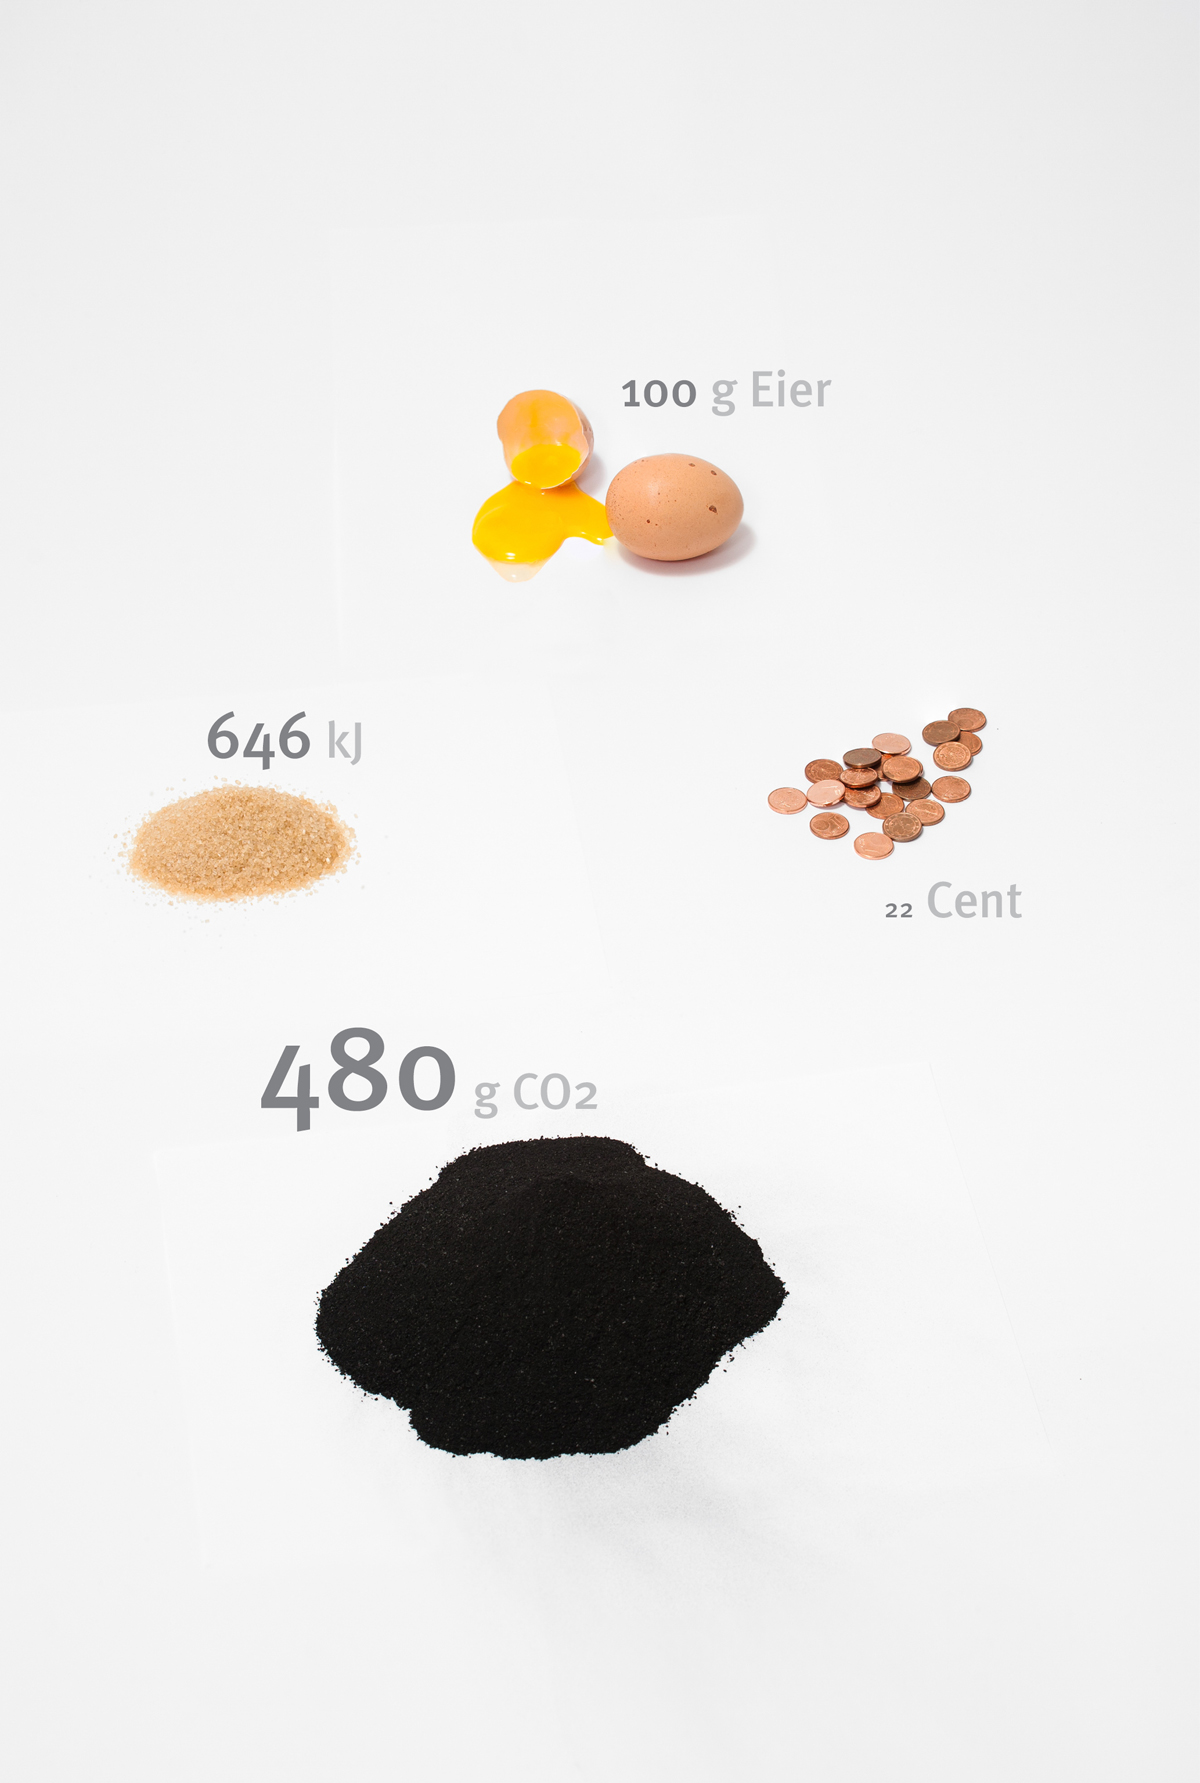
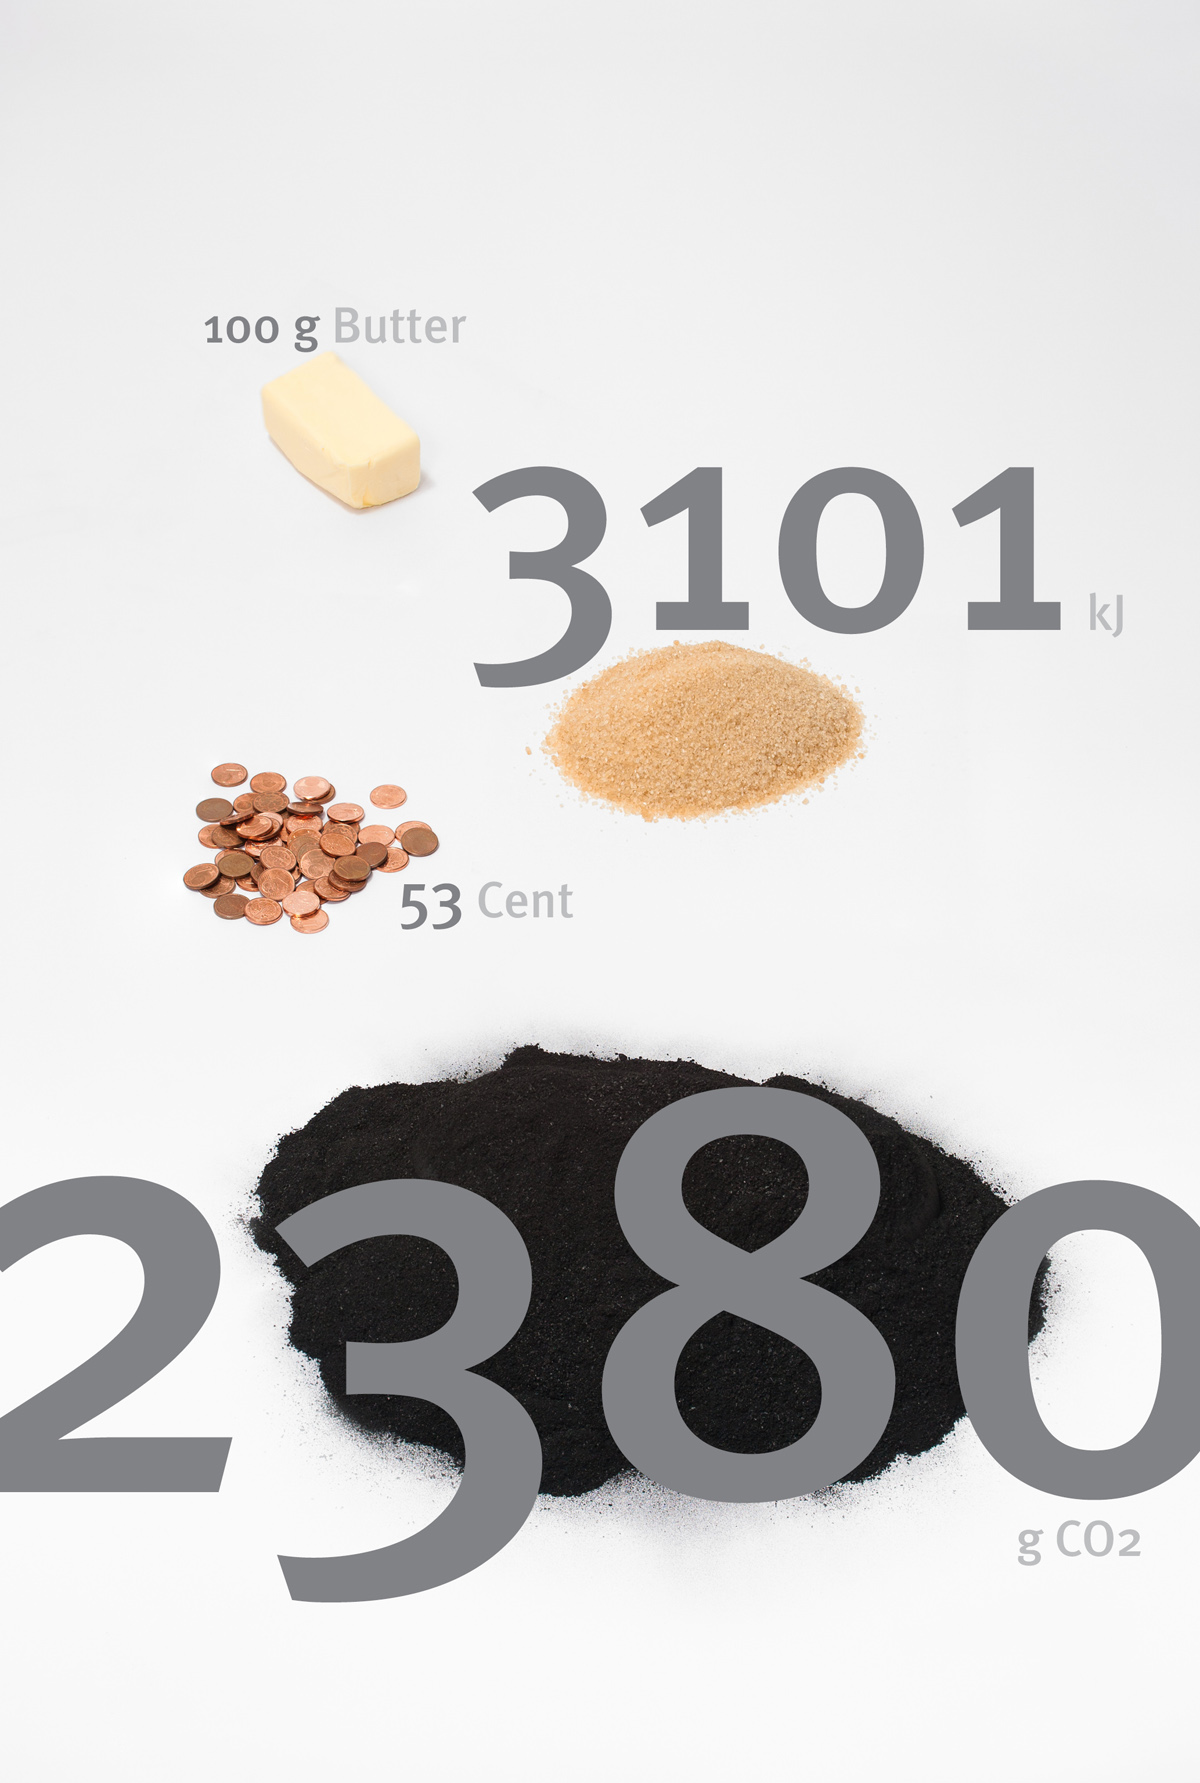
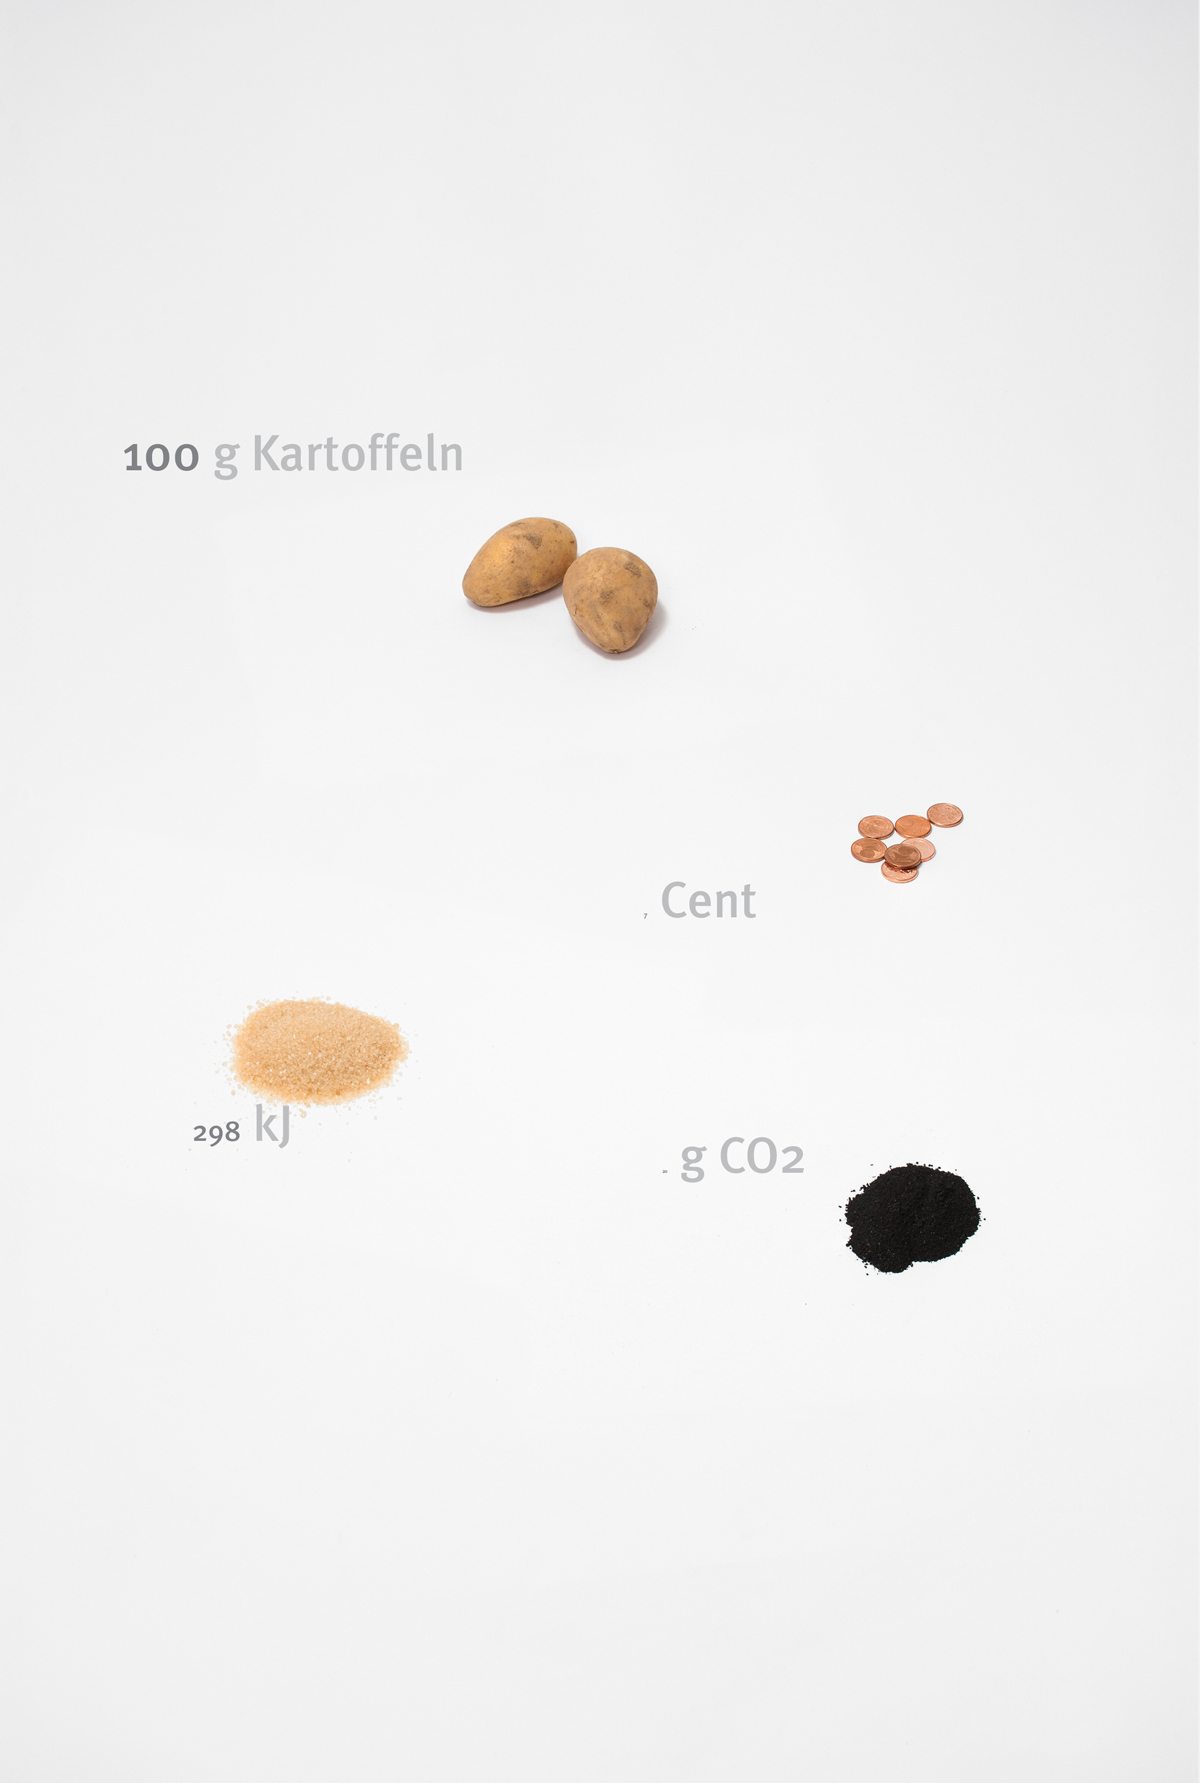
Evaluating information within the production of an edible was a fundamental part of the project. Analogue information visualizations helped to understand correlations between the different parameters. The CO² equivalent, the energy content and price of dishes proved to be the most significant factors as they vary a lot from edible to edible and furthermore give information about the content when directly compared.
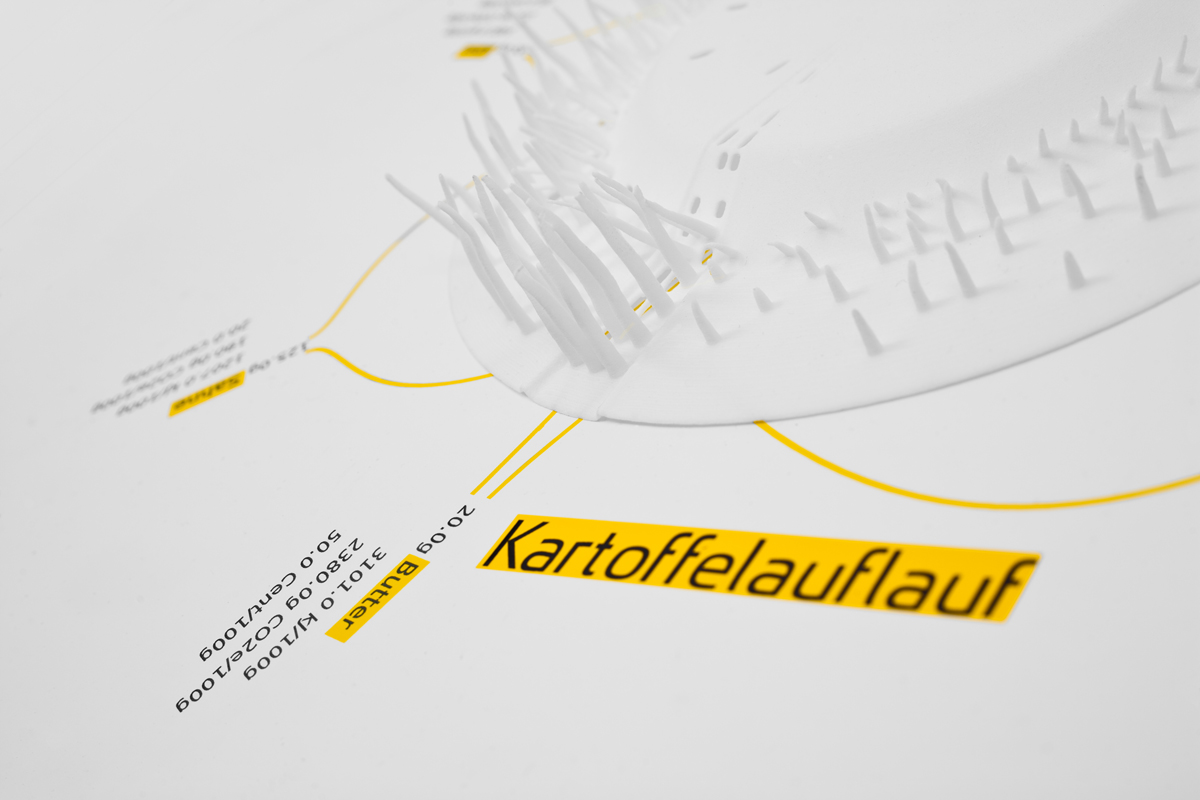
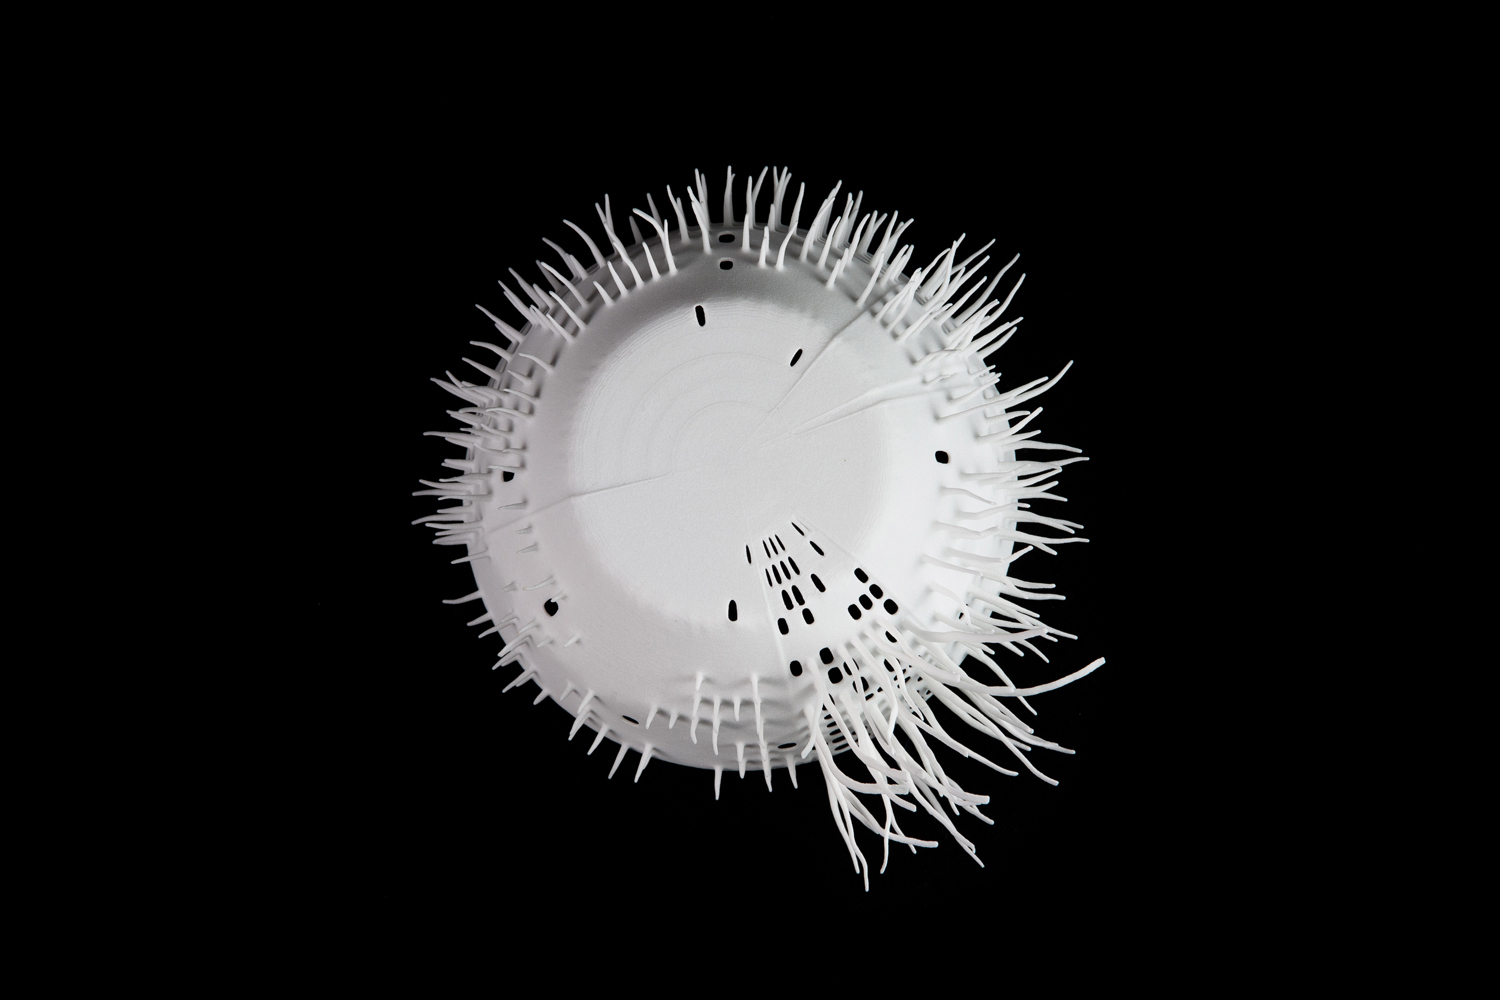
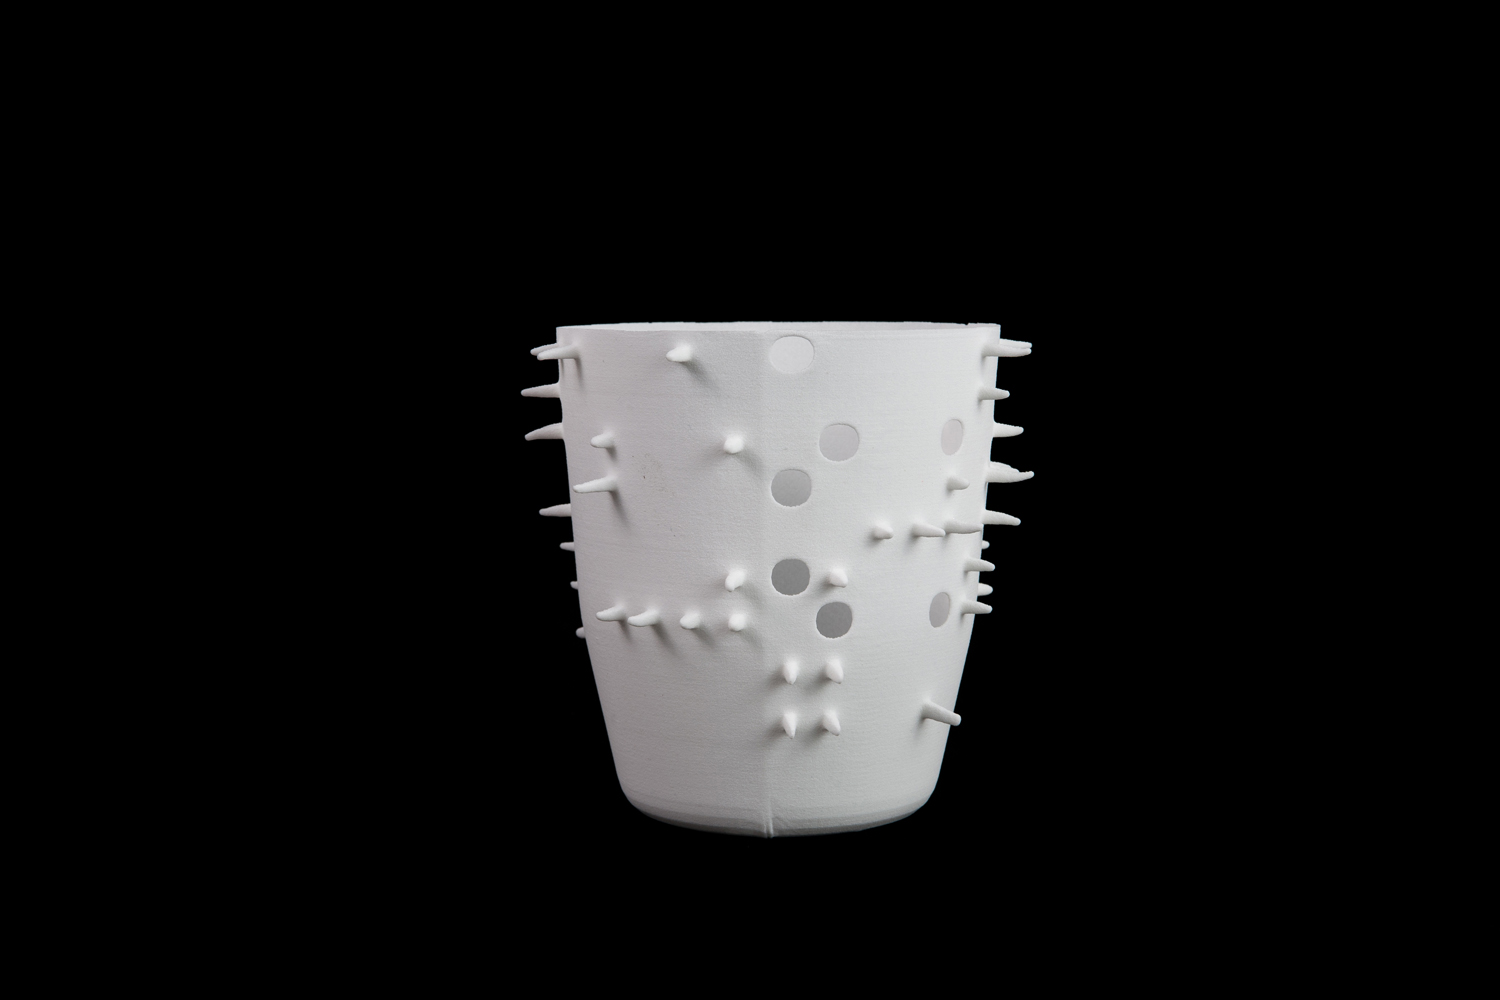
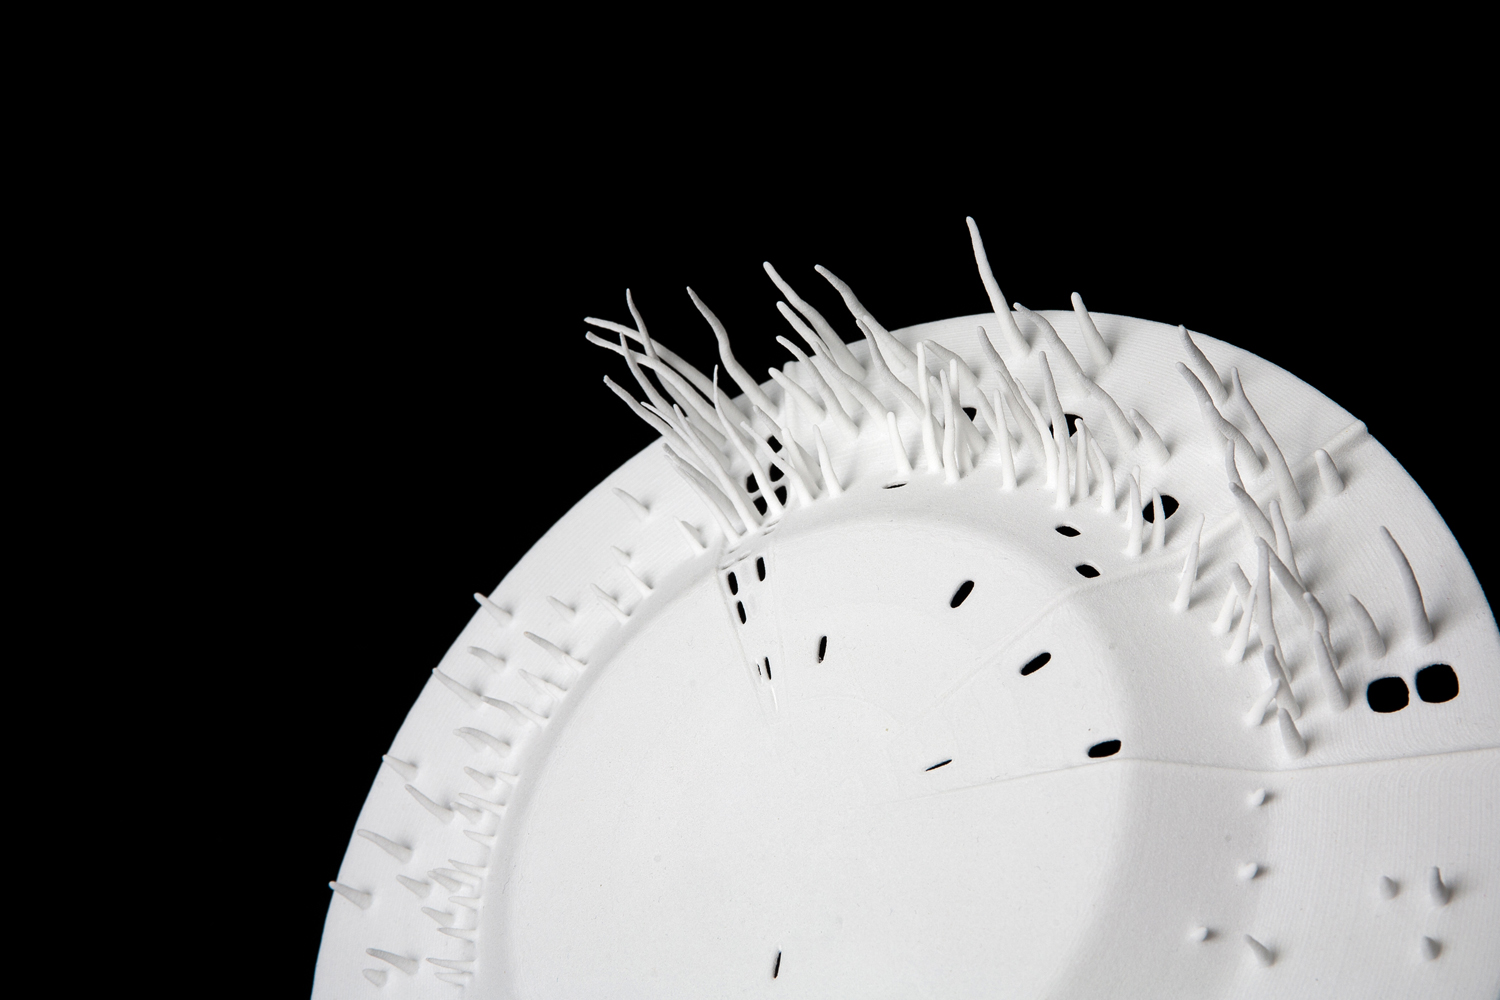
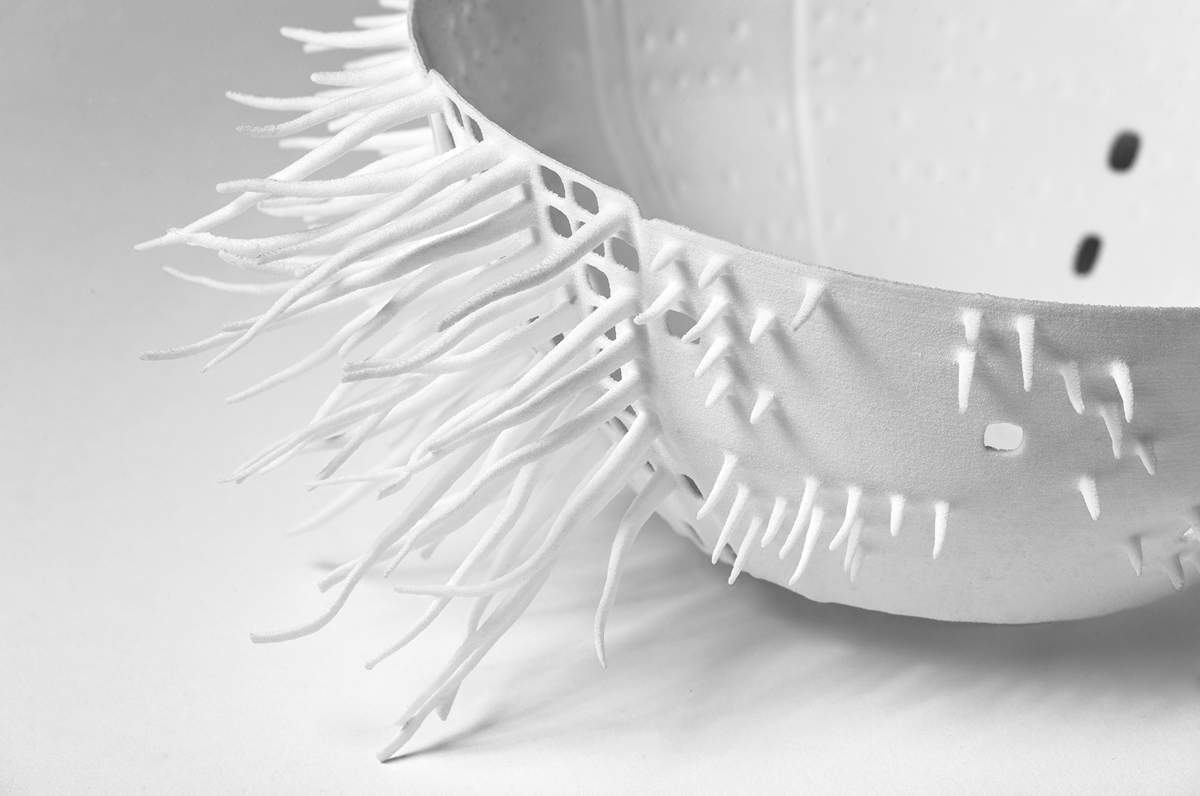
InfObjects is a series that consists of three objects – a cup, a bowl and a plate that accordingly to information are various in shape. Following the same rules the objects still turn out clearly different. Each object represents a certain dish: a potato pie for example would be illustrated as a plate. A segmentation within the object shows the single ingredients.
The products are not intended to be objects of utility. On the contrary: The information does not only have direct impact on the shape but it also influences the functionality. So that for example a lot of CO² produced is illustrated by many holes that will lead the product even further away from usability. This `unfunctionality´ is revealed at first glance and it is exactly this moment of surprise that emphasizes the project´s true intention: raising awareness for the topic of how food is produced and consumed.
The project was part of the show 'FOOD - Bigger than the plate' at Victoria & Albert museum in London from May until October 2019.
